
RNA sequencing: which genes changed, and what that means for your hypothesis.
We measure the activity of every gene in your samples, compare your groups and connect the changed genes to biological pathways.
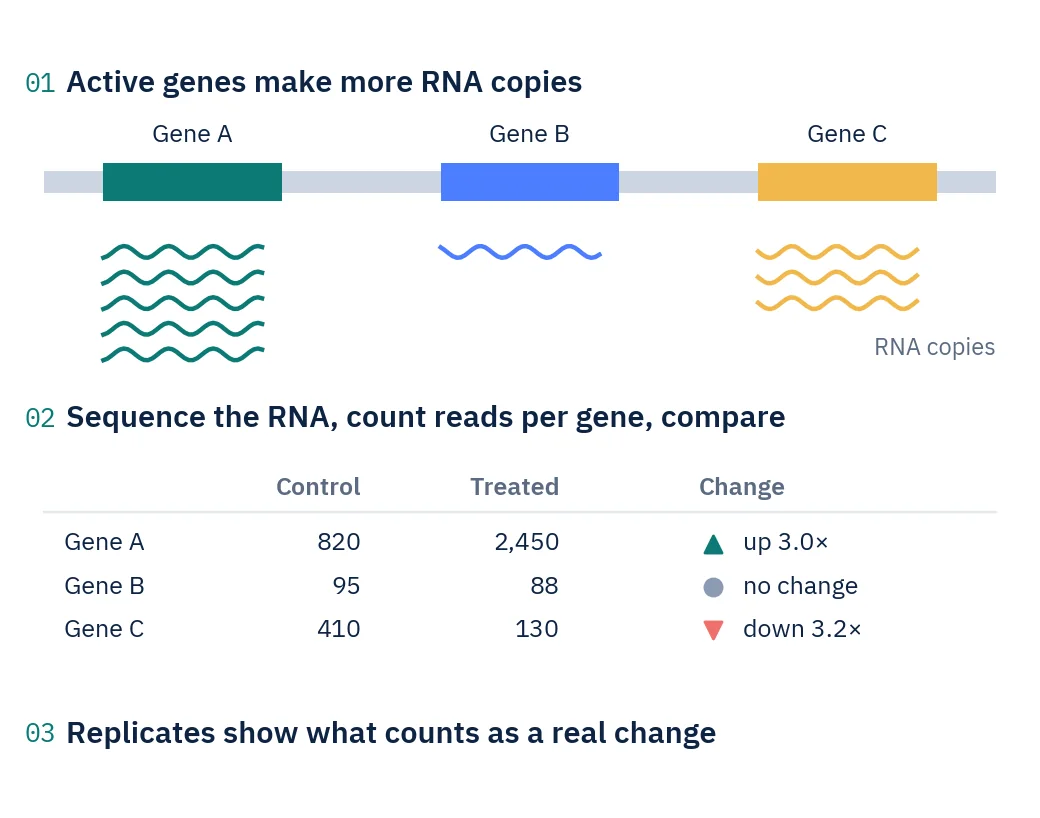
Counting RNA copies shows how active each gene is.
A gene that is switched on is copied into messenger RNA, and a busy gene makes many copies. RNA sequencing reads millions of these molecules from each sample and counts how many come from each gene. That count measures gene activity at the moment the sample was taken.
Most RNA in a cell is ribosomal RNA, which says little about gene activity. Before sequencing, the library is focused on the informative part: messenger RNA is captured by its poly(A) tail, or ribosomal RNA is removed so that non-coding RNAs and bacterial transcripts stay in the data.
Samples receive different numbers of reads, so counts are normalised before groups are compared. A gene counts as changed when the difference between groups is clearly larger than the natural variation between biological replicates, after correcting for testing about 20,000 genes at once.
Key terms
- Transcriptome
- All the RNA molecules in a sample at one moment.
- mRNA
- The RNA copy of a gene that the cell uses to make a protein.
- Biological replicate
- An independent sample from the same group, such as another animal or culture. Replicates measure natural variation.
- Normalisation
- Scaling counts so that samples sequenced to different depths can be compared fairly.
- Log2 fold change
- How much a gene changed on a doubling scale: +1 means twice as much, −1 means half.
- Adjusted p-value
- A p-value corrected for testing thousands of genes at once, which keeps false discoveries in check.
Bring the question. We design the experiment around it.
- Which genes respond to the treatment, and how strongly?
- Which biological pathways and processes are affected?
- Do my samples group by condition, or is an outlier driving the result?
- Which of several treatments differ from the control?
Where it is used
- Treatment and disease studiesGene activity in treated versus control, or diseased versus healthy samples.
- Mechanism and pathway researchLinking expression changes to biological processes and signalling pathways.
- Biomarker discoveryGenes whose activity separates groups or tracks a response.
- Plants and cropsStress responses and trait research, including species beyond the usual model organisms.
- Host and virus togetherHost gene activity and viral transcripts measured in the same infected samples.
- Organisms without a genomeA transcript catalogue assembled directly from the reads.
Four steps from RNA to results.
- Step 1
Plan the comparison
We agree on groups, replicates and the comparisons that answer your question. Three or more biological replicates per group is the usual minimum.
- Step 2
Check the RNA
RNA amount and integrity are checked before library preparation, so problems show up early.
- Step 3
Build libraries and sequence
mRNA is captured or ribosomal RNA removed, and the libraries are sequenced as 150-letter read pairs.
- Step 4
Analyse and report
Reads are placed on the genome and counted per gene, then groups are compared and pathways tested, with figures and a Methods section.
What the analysis shows you.
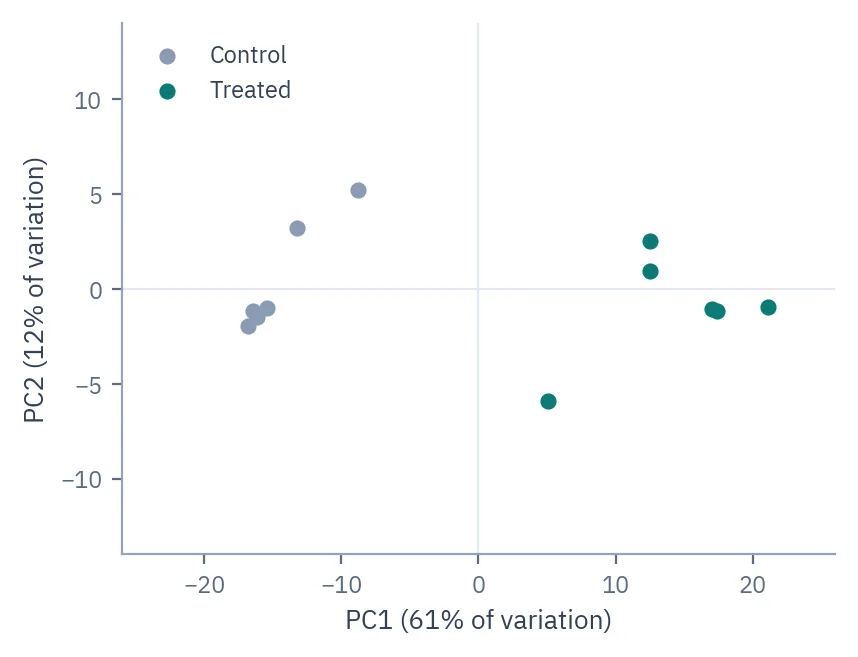
Do the samples group?
Each dot is one sample. Replicates sit together and the treatment separates the groups along the first axis, a sign of consistent data.
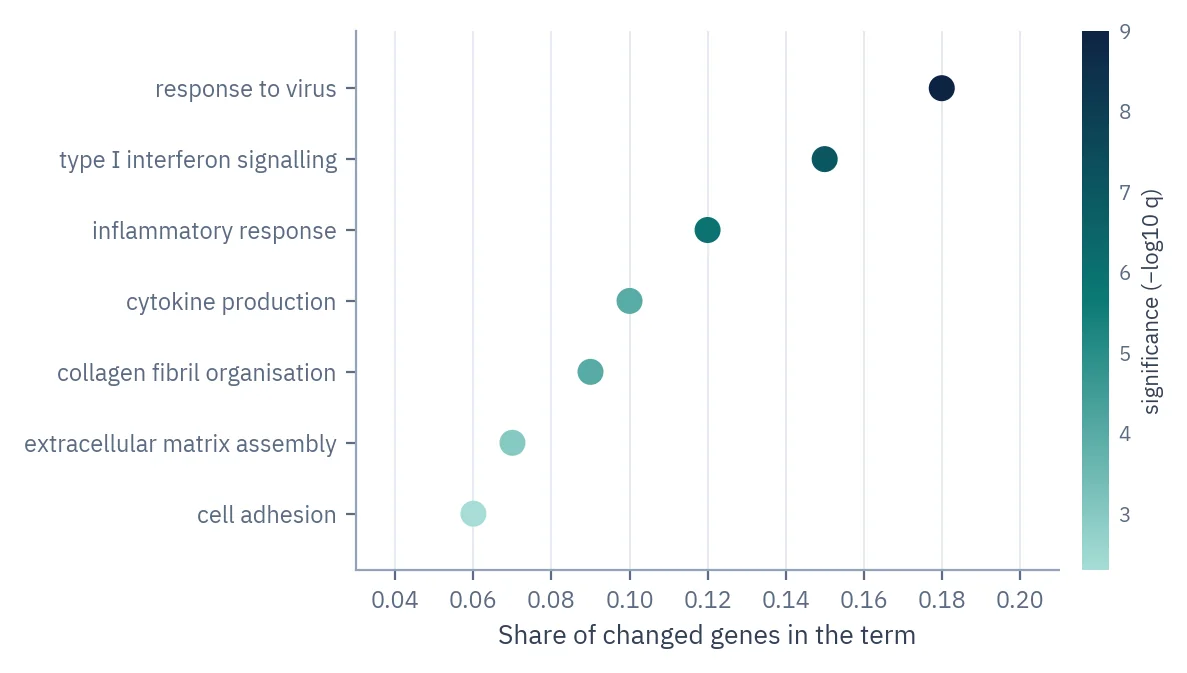
Pathways behind the change
Biological processes that appear more often among the changed genes than chance would allow. Darker dots mean stronger evidence.
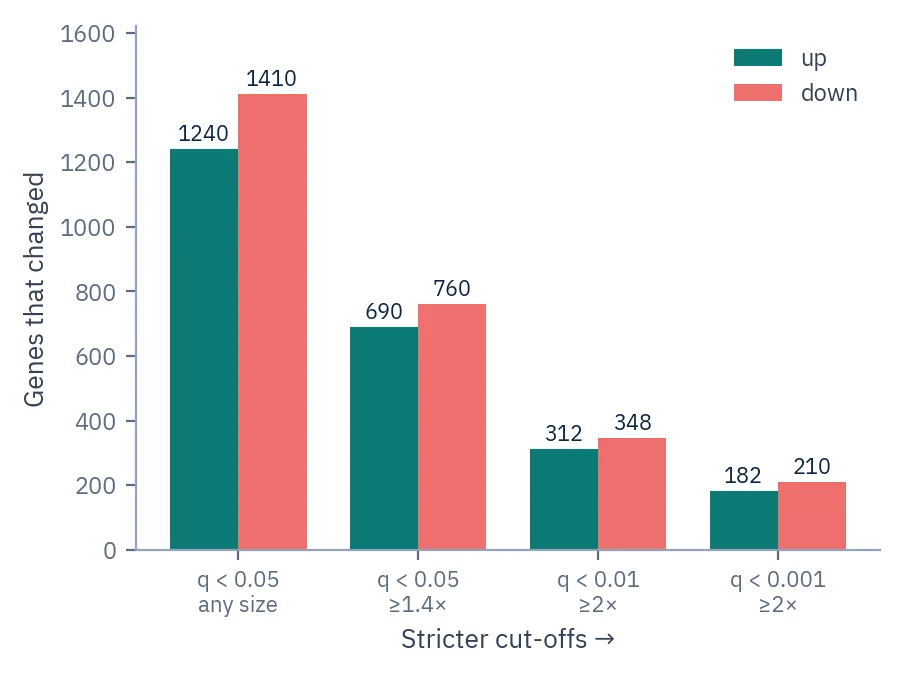
How robust is the gene list?
The number of changed genes at stricter and stricter cut-offs, so you see how much of the result holds up.
Included as standard every project
- Read quality controlAdapters and low-quality bases are removed, and every sample is checked.
- Alignment and gene countsReads are placed on the reference genome and counted per gene.
- Sample overviewPCA and sample-distance plots show whether replicates agree.
- Differential expressionChanged genes with fold change and adjusted p-value, at several cut-offs.
- Pathway enrichmentGO and KEGG terms over-represented among the changed genes.
Added for your question custom
- Several groupsSeparate results for every comparison in multi-group designs.
- Non-model organismsSpecies beyond human, mouse and rat, with the genome and annotation set up for your project.
- De novo transcriptomeA transcript catalogue with a completeness check and gene function annotation, when no genome exists.
- Host and virus readsViral transcripts quantified alongside host genes in infected samples.
What goes in, and how we run it.
- Libraries
- Poly(A) mRNA · rRNA-depleted total RNA · small RNA
- Sequencing
- Illumina NovaSeq X Plus or NextSeq 2000, 150 bp read pairs
- Typical depth
- 20–30 million read pairs per sample for gene-level results in human or mouse
- Replicates
- Three or more biological replicates per group
- Samples
- Cells, tissue, blood, plants and microbes · degraded and FFPE RNA through total RNA protocols
- Main tools
- STAR, Salmon, DESeq2, clusterProfiler
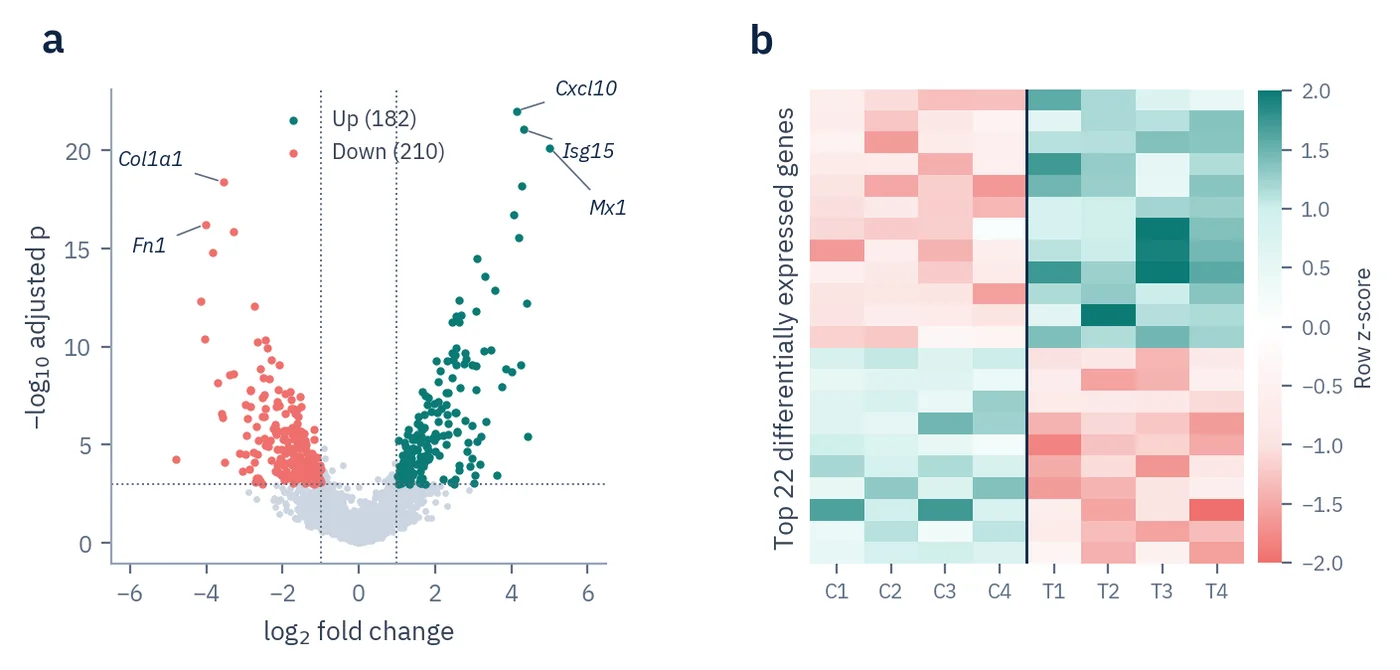
Figures, interpretation and Methods, ready for the manuscript.
- ReportInterpretation written against your hypothesis
- FiguresPublication-ready figures for the manuscript
- MethodsMaterials & Methods text for the paper
- Tables and dataAll results as tables, plus the processed data files
mRNA or total RNA?
Send us the question and we recommend one, including when the cheaper option is enough.
| Aspect | mRNA sequencing | Total RNA sequencing |
|---|---|---|
| Captures | Messenger RNA with a poly(A) tail, mostly protein-coding genes | All RNA except ribosomal RNA, including non-coding RNA |
| Organisms | Animals, plants and fungi | Also bacteria, whose mRNA has no poly(A) tail |
| RNA quality | Works best with intact RNA | Copes with degraded and FFPE RNA |
| Reads needed | Fewer for gene-level answers | More for the same coverage of mRNA |
| Best when | Clean samples and questions about protein-coding genes | Degraded samples, non-coding RNA or bacteria |
Before you send samples
Related services
How many replicates do I need?
At least three biological replicates per group. For subtle effects or variable samples, plan for more: a large benchmark study recommends six.
How many reads per sample?
About 20–30 million read pairs give gene-level results in human or mouse. Total RNA sequencing needs around 40 million, a de novo transcriptome 50–100 million, and bacteria fewer.
mRNA or total RNA sequencing?
mRNA sequencing suits intact RNA and protein-coding genes. Total RNA sequencing also keeps non-coding RNA, works for bacteria and copes better with degraded RNA, and needs more reads.
My RNA is degraded or from FFPE blocks. Can I still use it?
Yes. Total RNA protocols remove ribosomal RNA instead of relying on the poly(A) tail, so fragmented RNA is still read along the whole gene rather than only at its end.
How do you decide which genes changed?
Each gene is tested with DESeq2, and p-values are corrected for testing thousands of genes. You get the results at several fold-change and significance cut-offs, so you can see how robust the list is.
Can you analyse an organism without a reference genome?
Yes. We assemble a transcript catalogue directly from the reads, check how complete it is and annotate likely gene functions.
I already have RNA-seq data. Can you only analyse it?
Yes. Send the raw FASTQ files or a public accession number, with a sample sheet that lists the groups.
If something goes wrong on this project, you pay €0 to fix it.
- Sample problems €0
- Library prep redo €0
- Resequencing €0
- Reviewer re-analysis €0