
Amplicon sequencing: which microbes live in your samples, and how communities differ.
We read one marker gene from the bacteria, fungi or other organisms in each sample, then compare your groups. You get the community profile, the statistics and figures ready for the paper.
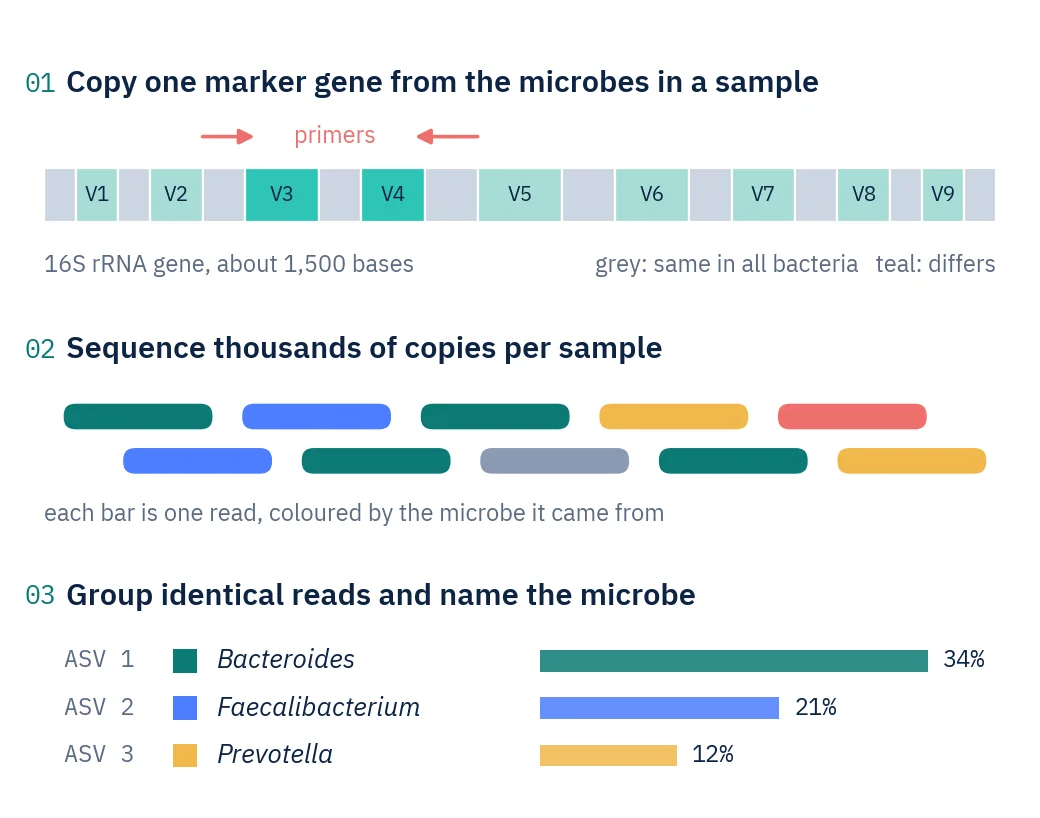
One marker gene works as a name tag for microbes.
Bacteria carry a gene called 16S rRNA. Most of it is the same in every species, but nine short stretches, the variable regions, differ from one group to the next. We copy one of these stretches from all the DNA in your sample and read the copies thousands of times.
Identical reads are grouped into exact sequence variants, and each variant is matched against a reference database to name the organism. Counting the reads per organism shows what each sample contains and in what proportions.
Fungi are profiled on a different marker, the ITS region, and other eukaryotes on the 18S gene. Animal DNA traces in water or sediment, known as environmental DNA, are read on the COI gene. One project can combine several markers.
Key terms
- Amplicon
- A short piece of DNA copied many times so that it can be sequenced.
- Variable region
- A stretch of the 16S gene that differs between bacterial groups. V3–V4 is our default.
- Sequence variant (ASV)
- An exact sequence found in the data. Identical reads are grouped into one variant, which stands for one type of microbe.
- Relative abundance
- The share of a sample’s reads that belongs to one organism.
- Alpha diversity
- How many different microbes a sample holds, and how evenly they are spread.
- Beta diversity
- How different the communities of two samples are, shown as a map where similar samples sit close together.
Bring the question. We design the experiment around it.
- Which bacteria go up or down after my treatment?
- Is diversity lower in patients than in healthy controls?
- Do my groups differ in overall community make-up?
- Which bacteria, fungi and animals live in this soil, water or sediment?
Where it is used
- Human and animal microbiomeGut, oral, skin and respiratory samples compared across diets, treatments and time points.
- Disease and treatment studiesCommunity changes between patients and controls, or before and after an intervention.
- Soil and plant healthMicrobes in soils and roots under healthy and stressed crops.
- Water, sediment and eDNASurveys of bacteria, fungi and animals from DNA left in the environment.
- Food and fermentationStarter cultures, fermented foods and sourdough communities.
- Samples with very little DNASwabs, cleanroom surfaces and other low-biomass material.
Four steps from sample to figures.
- Step 1
Plan the markers
We agree on the question, the markers (16S, ITS, 18S or COI) and how many samples each group needs.
- Step 2
Check the DNA
Samples are checked before library preparation, so problems show up while they are still cheap to fix.
- Step 3
Copy and sequence
The marker region is copied from every sample, tagged with a sample barcode and sequenced as 300-letter read pairs.
- Step 4
Analyse and report
Reads become named sequence variants, then diversity, group comparisons, figures and a Methods section.
What the analysis shows you.
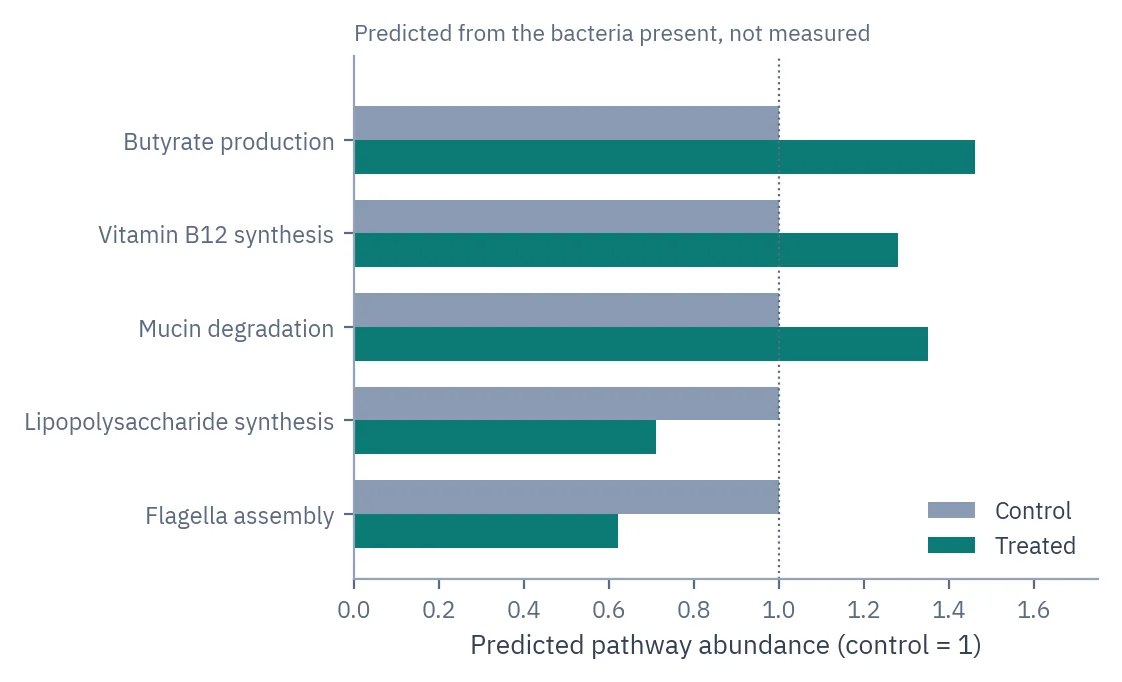
Predicted functions
Which metabolic pathways the community probably carries, estimated from the bacteria that are present.
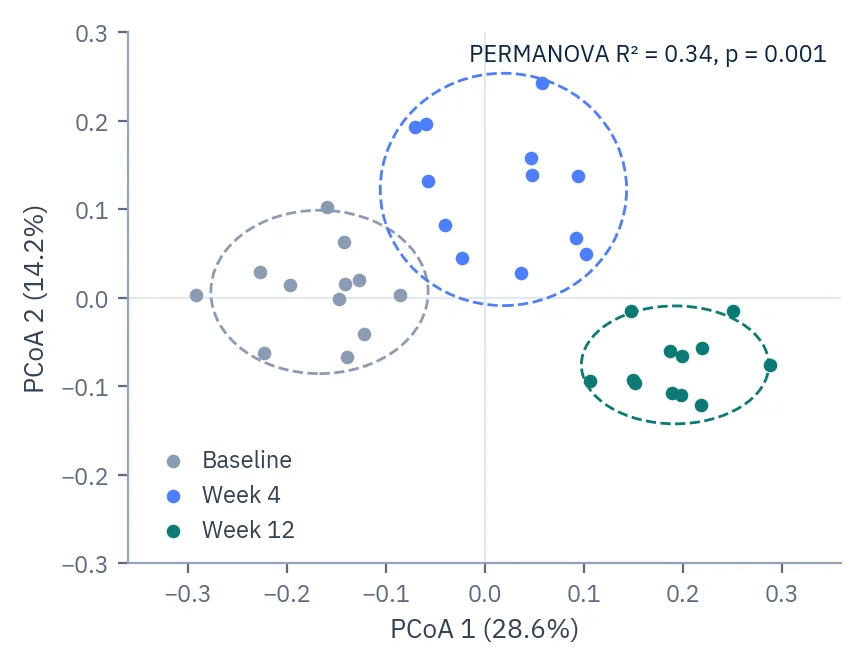
Community map
Each dot is one sample. Samples with similar communities sit close together, and the PERMANOVA test shows whether the groups really differ.
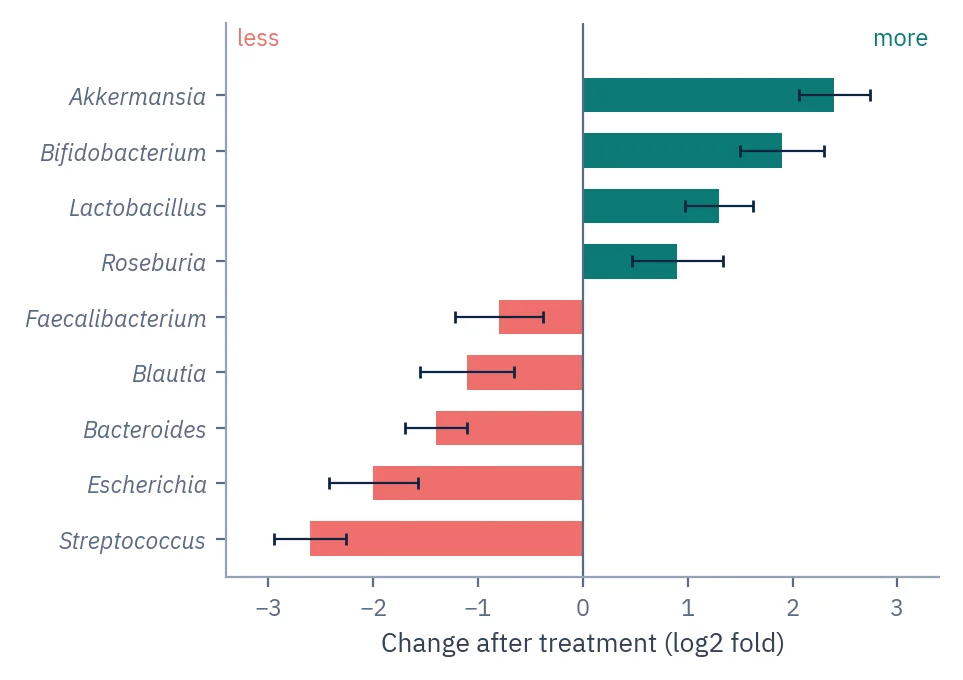
Which bacteria changed
Genera that became more common after treatment point right, those that declined point left, each with its uncertainty.
Included as standard every project
- Quality filtering and sequence variantsPrimers and low-quality bases are removed, and identical reads are grouped into exact sequence variants.
- A name for every variantEach variant is matched to a reference database, from phylum down to genus.
- Composition tables and bar chartsThe share of each organism in every sample, at every taxonomic level.
- Diversity within and between samplesRichness and evenness per sample, and a community map with a test for group differences.
- Differential abundanceWhich organisms changed between groups, corrected for testing many at once.
Added for your question custom
- Predicted functionsLikely gene functions and metabolic pathways, inferred from the bacteria present.
- Several markers in one projectBacteria, fungi, other eukaryotes and animals profiled side by side.
- Co-occurrence networksWhich microbes tend to rise and fall together.
- Machine-learning classificationWhether the community predicts a group or an outcome.
What goes in, and how we run it.
- Markers
- 16S V3–V4 for bacteria · ITS for fungi · 18S for other eukaryotes · COI for animal eDNA
- Sequencing
- Illumina MiSeq or NextSeq 1000, 2×300 bp read pairs
- Typical depth
- About 50,000 read pairs per sample
- Samples
- Stool, soil, sediment, water, swabs, tissue, insects, low-biomass material
- Input
- Extracted DNA or raw samples · concentrations below 1 ng/µL accepted
- Main tools
- DADA2, QIIME 2, SILVA, ANCOM-BC, PICRUSt2
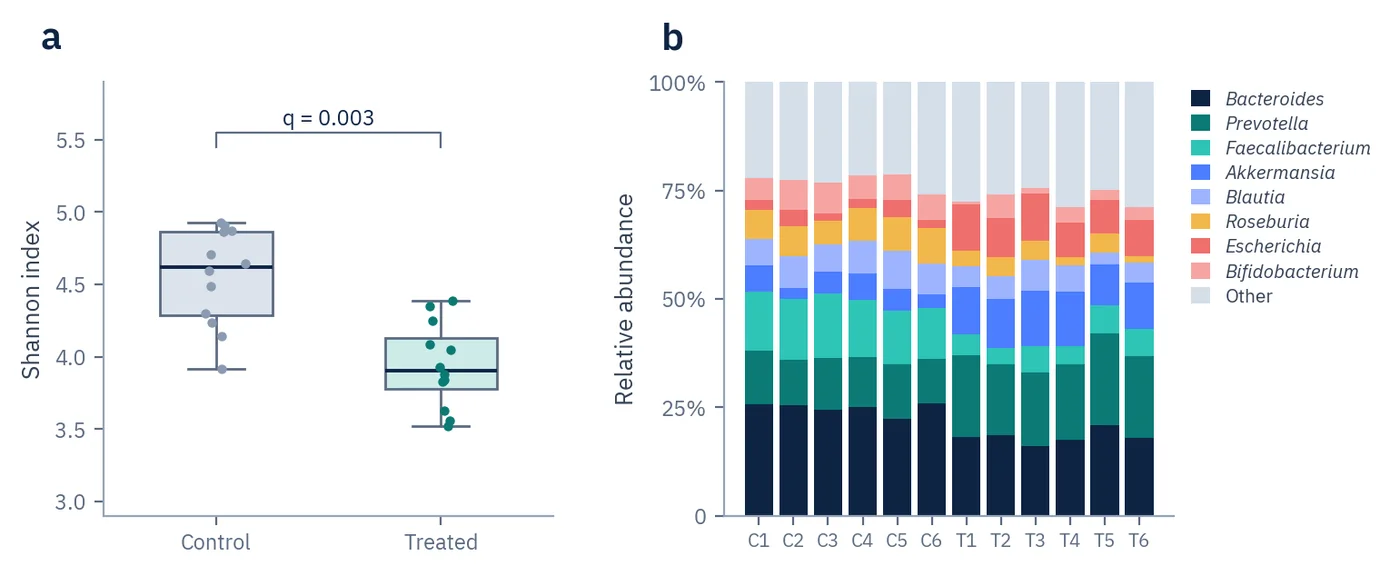
Figures, interpretation and Methods, ready for the manuscript.
- ReportInterpretation written against your hypothesis
- FiguresPublication-ready figures for the manuscript
- MethodsMaterials & Methods text for the paper
- Tables and dataAll results as tables, plus the processed data files
Amplicon or shotgun?
Send us the question and we recommend one, including when the cheaper option is enough.
| Aspect | Amplicon sequencing | Shotgun metagenomics |
|---|---|---|
| What is read | One marker gene | All DNA in the sample |
| Naming depth | Usually genus | Species |
| Function | Predicted from who is there | Read from the genes themselves |
| Cost per sample | Lower, so more samples fit the budget | Higher, with deeper sequencing |
| Best when | Many samples, fungi and eukaryotes, very little DNA | Genes, genomes and cell counts matter |
Before you send samples
Related services
Which region should I sequence?
V3–V4 is our default for bacteria. Fungi are read on ITS, other eukaryotes on 18S and animal eDNA on COI. Use the same region for every sample in a study so the results stay comparable.
Will I get species names?
Usually genus names. A short stretch of the 16S gene rarely separates closely related species. When species matter, shotgun metagenomics is the better choice.
Can one project cover bacteria, fungi and animals?
Yes. Each marker is sequenced and analysed on its own, with its own tables and diversity results, within the same project.
Do you report ASVs or OTUs?
Exact sequence variants (ASVs). They are reproducible and can be compared directly with other studies that use them.
Can amplicon data tell me what the microbes do?
As a prediction: likely gene functions and pathways are estimated from the bacteria present. To measure genes directly, choose shotgun metagenomics.
My samples contain very little DNA. Should I still send them?
Yes. Most samples we receive are below 1 ng/µL, and we sequence them. The DNA check before library preparation tells you what to expect.
I already have 16S data. Can you only analyse it?
Yes. Send the raw FASTQ files or the accession number of a public dataset, with a sample sheet that lists the groups.
If something goes wrong on this project, you pay €0 to fix it.
- Sample problems €0
- Library prep redo €0
- Resequencing €0
- Reviewer re-analysis €0