
DNA methylation sequencing: where the chemical switches on your DNA differ between groups.
Bisulfite sequencing measures methylation at single CpG sites across the genome or its CpG-rich regions, then finds the sites, regions and promoters that changed and the genes they sit in.
A chemical trick makes methylation readable.
DNA methylation is a small chemical tag on the letter C that helps switch genes on and off without changing the DNA sequence. In animals it sits mostly where a C is followed by a G, a CpG site. Plants also methylate Cs in other contexts.
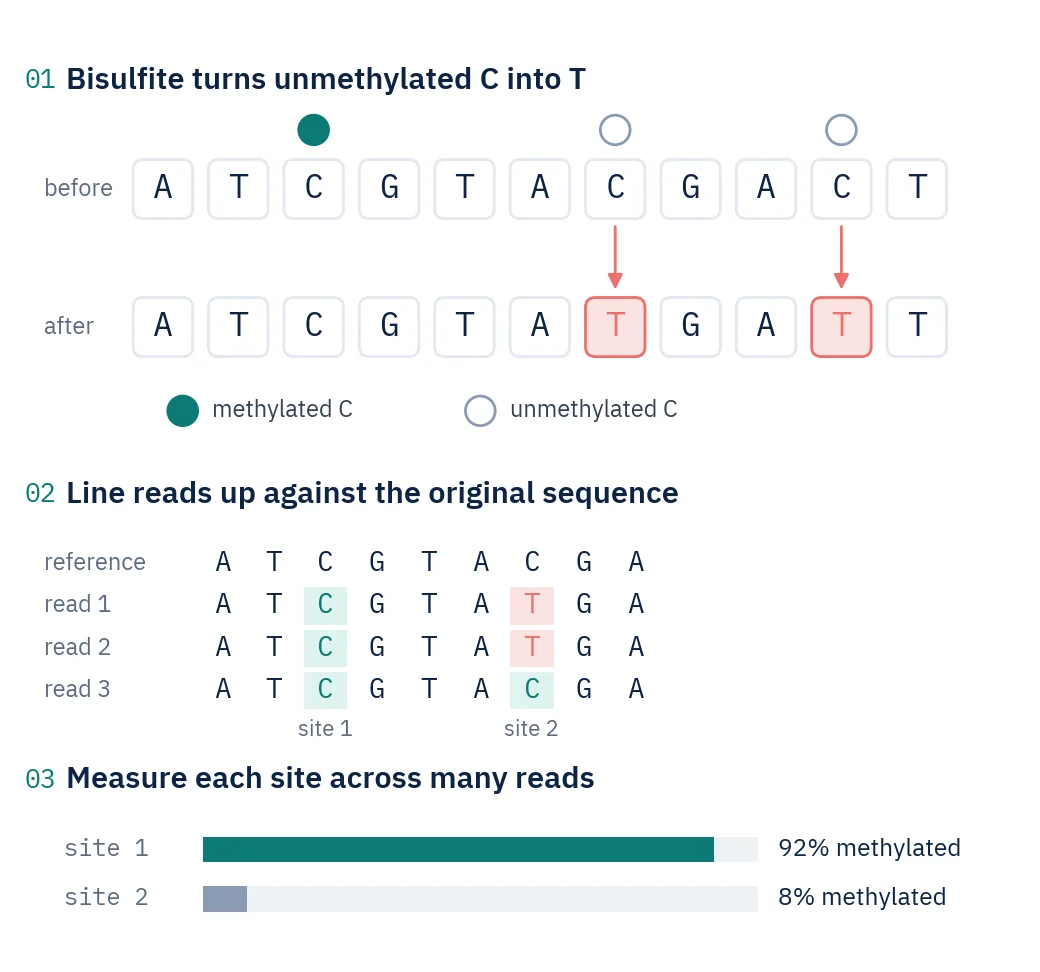
Sequencers cannot see the tag directly, so the DNA is treated with bisulfite first. Bisulfite turns every unmethylated C into T, while methylated C stays C. After sequencing, each C that is still a C marks a methylated site.
Counting reads at each site gives its methylation level: 9 reads with C out of 10 means 90% methylated. Comparing these levels between groups reveals single sites, regions and promoters that gained or lost methylation.
Whole-genome bisulfite sequencing (WGBS) reads the entire genome. Reduced-representation bisulfite sequencing (RRBS) cuts the DNA with an enzyme and reads only CpG-rich fragments, which covers most promoters for far less sequencing.
Key terms
- CpG site
- A place where the letter C is followed by G. The main target of methylation in mammals.
- Bisulfite conversion
- A chemical treatment that turns unmethylated C into T and leaves methylated C unchanged.
- Methylation level
- The share of reads at a site that show methylation, from 0% to 100%.
- DMR
- Differentially methylated region: a stretch of DNA whose methylation differs between groups.
- Hyper- and hypomethylation
- More or less methylation in one group than in the other.
- RRBS
- Bisulfite sequencing of the CpG-rich part of the genome, selected with a restriction enzyme.
Bring the question. We design the experiment around it.
- Where does methylation differ between my groups, at single sites and across regions?
- Which gene promoters gain or lose methylation?
- Is the change mostly a gain or a loss of methylation?
- Do my samples group by treatment on their methylation alone?
Where it is used
- Development and differentiationMethylation changes as cells specialise or organisms age.
- Disease mechanismsPromoter methylation changes linked to disease states.
- Environment and treatmentGroups exposed to different conditions, diets or treatments.
- Plant biology and cropsMutants, stress responses and traits, including plant-specific methylation contexts.
- Biomarker discoveryMethylation differences that separate groups.
- Lines and mutantsWild type compared with knockout or mutant lines.
Four steps from DNA to changed regions.
- Step 1
Choose WGBS or RRBS
We match the method to your question and sample numbers: whole genome for discovery, RRBS for more samples focused on promoters.
- Step 2
Check the DNA
DNA amount and integrity are checked before bisulfite treatment and library preparation.
- Step 3
Convert and sequence
Bisulfite treatment, library preparation and sequencing to the agreed depth.
- Step 4
Analyse and report
Methylation is called at every covered CpG, then sites, regions and promoters are compared, annotated to genes and tested for pathways.
What the analysis shows you.
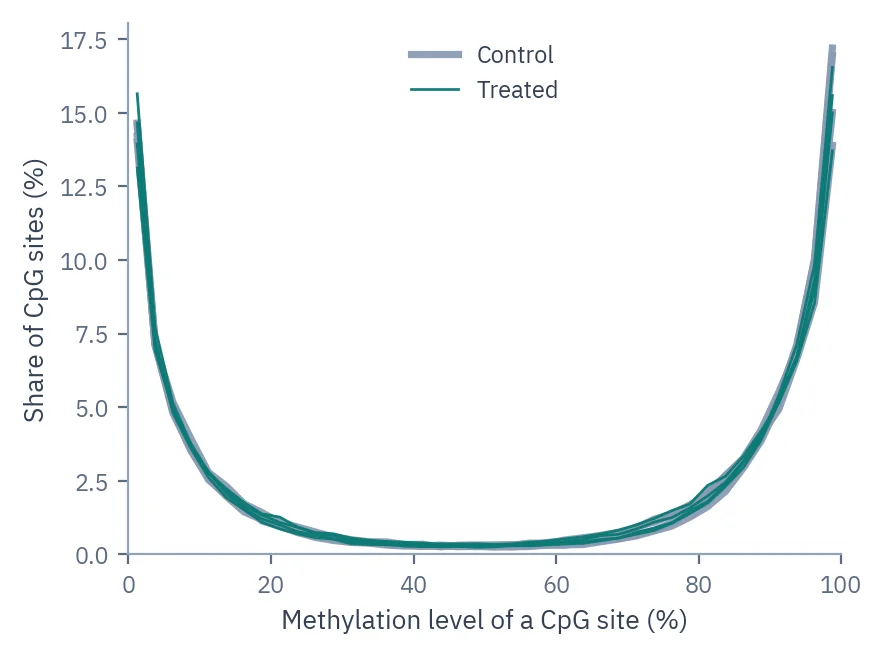
Data quality at a glance
Most CpG sites are almost fully methylated or unmethylated, and every sample shows the same pattern, a sign of consistent data.
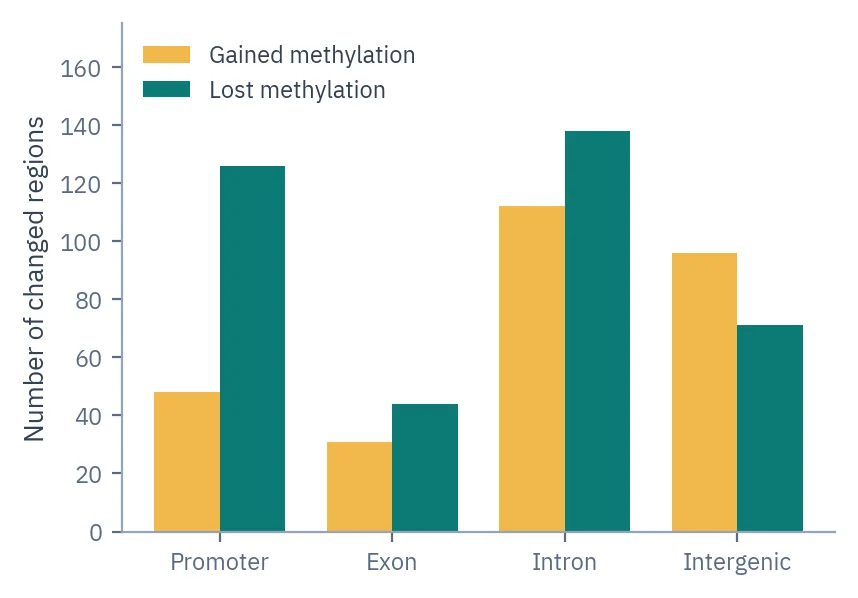
Where the changes fall
Regions that gained or lost methylation, sorted by where they sit relative to genes.
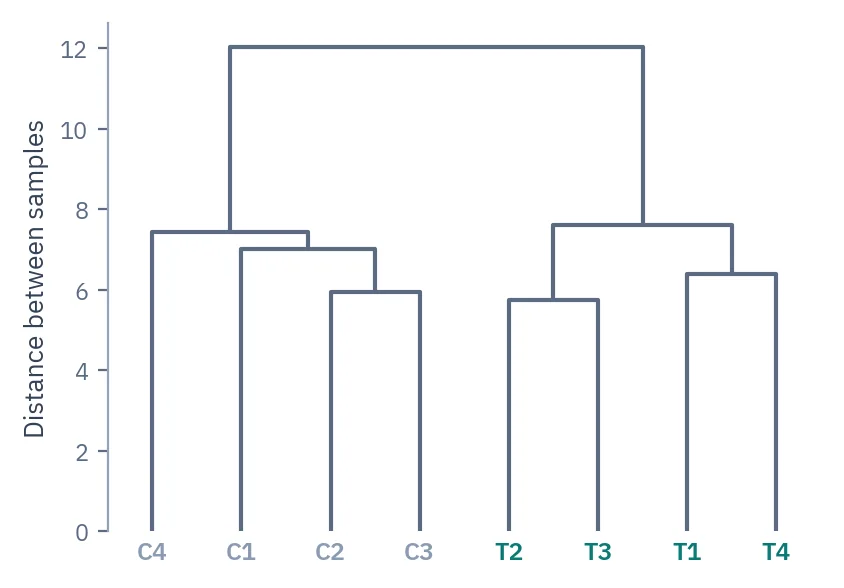
Do the samples group?
Samples clustered by their methylation profiles. Treated and control samples form two separate branches.
Included as standard every project
- Quality control and alignmentReads are trimmed and aligned with a bisulfite-aware aligner.
- Methylation callingThe methylation level of every CpG covered by at least 10 reads.
- Sample overviewCorrelation, PCA and clustering of samples.
- Differential methylationChanged sites, 1 kb regions and promoters, split into gains and losses.
- Annotation and pathwaysChanged regions linked to genes and promoters, with GO and KEGG enrichment.
Added for your question custom
- Plant methylation contextsCHG and CHH methylation in addition to CpG for plant genomes.
- RRBS for larger studiesThe CpG-rich part of the genome for more samples.
- Several comparisonsSeparate results for each pair of groups.
What goes in, and how we run it.
- Methods
- Whole-genome bisulfite sequencing (WGBS) · reduced-representation bisulfite sequencing (RRBS)
- Sequencing
- Illumina NovaSeq X Plus, 150 bp read pairs
- Typical depth
- About 30× genome coverage for WGBS
- Resolution
- Single CpG sites, 1 kb regions and promoters
- Samples
- Tissue, blood, cells and plants
- Main tools
- Bismark, nf-core/methylseq, methylKit, clusterProfiler
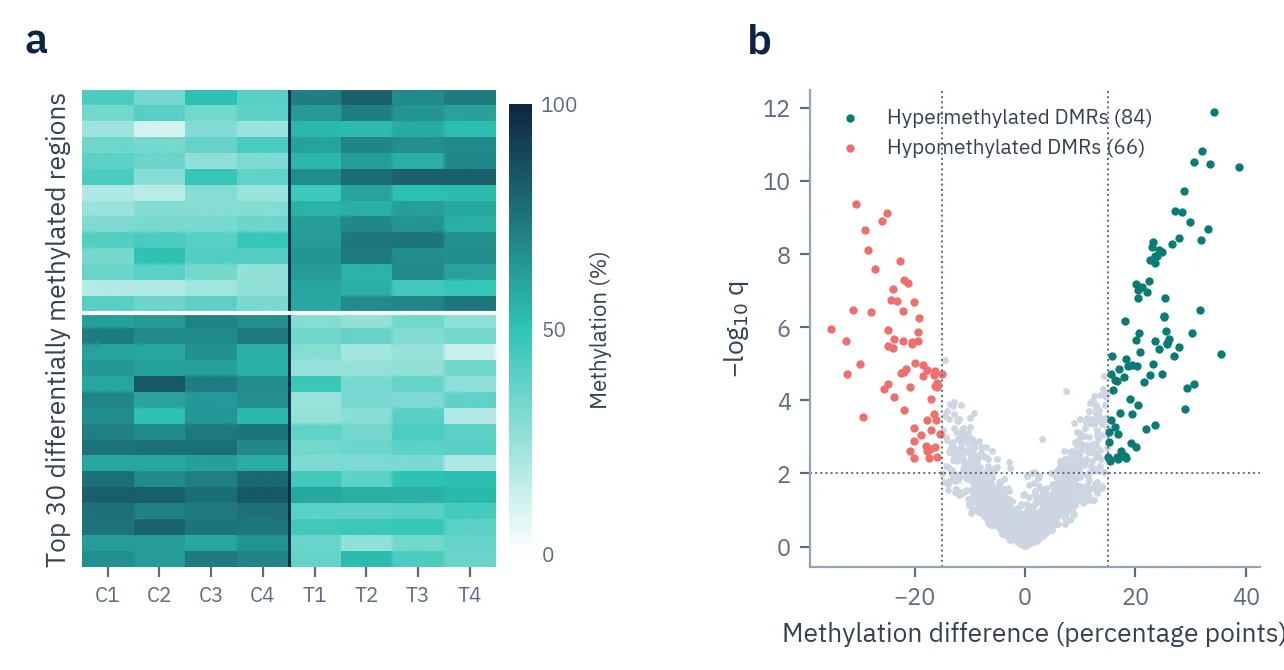
Figures, interpretation and Methods, ready for the manuscript.
- ReportInterpretation written against your hypothesis
- FiguresPublication-ready figures for the manuscript
- MethodsMaterials & Methods text for the paper
- Tables and dataAll results as tables, plus the processed data files
WGBS or RRBS?
Send us the question and we recommend one, including when the cheaper option is enough.
| Aspect | WGBS | RRBS |
|---|---|---|
| Covers | CpG sites across the whole genome | CpG-rich regions such as promoters and CpG islands |
| Sequencing per sample | Much more | Much less, so more samples fit |
| Plants | All methylation contexts | Mainly CpG-rich regions |
| Best when | Discovery, and regions outside CpG islands | Larger studies focused on promoters |
Before you send samples
Related services
WGBS or RRBS?
WGBS reads CpG sites across the whole genome and suits discovery. RRBS reads the CpG-rich fragments, including most promoters, for a fraction of the sequencing, so more samples fit the budget.
How deep should WGBS be?
About 30× genome coverage for human and other large genomes. Each CpG site needs at least 10 reads before it enters the statistics, and the depth is planned around that.
How many replicates do I need?
At least two biological replicates per group, as in the ENCODE standard. More replicates make smaller differences detectable.
What is the difference between a site, a region and a promoter result?
A site is a single CpG. A region is a 1 kb stretch of DNA. A promoter result covers 2 kb upstream to 500 bases downstream of a gene start. Each is reported as a gain or a loss of methylation.
Can you study plants?
Yes. Plants carry methylation in CpG, CHG and CHH contexts, and the analysis covers all three. Pathway enrichment is based on CpG sites.
Do I need a reference genome?
Yes. Bisulfite reads are aligned to a reference genome. Human, mouse, rat, barley and tomato are ready to use.
I already have bisulfite data. Can you analyse it?
Yes. Send the raw FASTQ files and tell us whether the libraries are WGBS or RRBS.
If something goes wrong on this project, you pay €0 to fix it.
- Sample problems €0
- Library prep redo €0
- Resequencing €0
- Reviewer re-analysis €0