
ddRAD sequencing: genetic markers that show how your populations and lines are structured.
We read the same small part of the genome in every individual, find the SNP markers that vary, and analyse structure, diversity and relatedness. The markers can also become a custom SNP array.
Read the same slice of the genome in every individual.
Sequencing whole genomes of hundreds of individuals is expensive, and most population questions do not need it. ddRAD reads only a small, fixed part of the genome, but the same part in every individual, so the results can be compared directly.
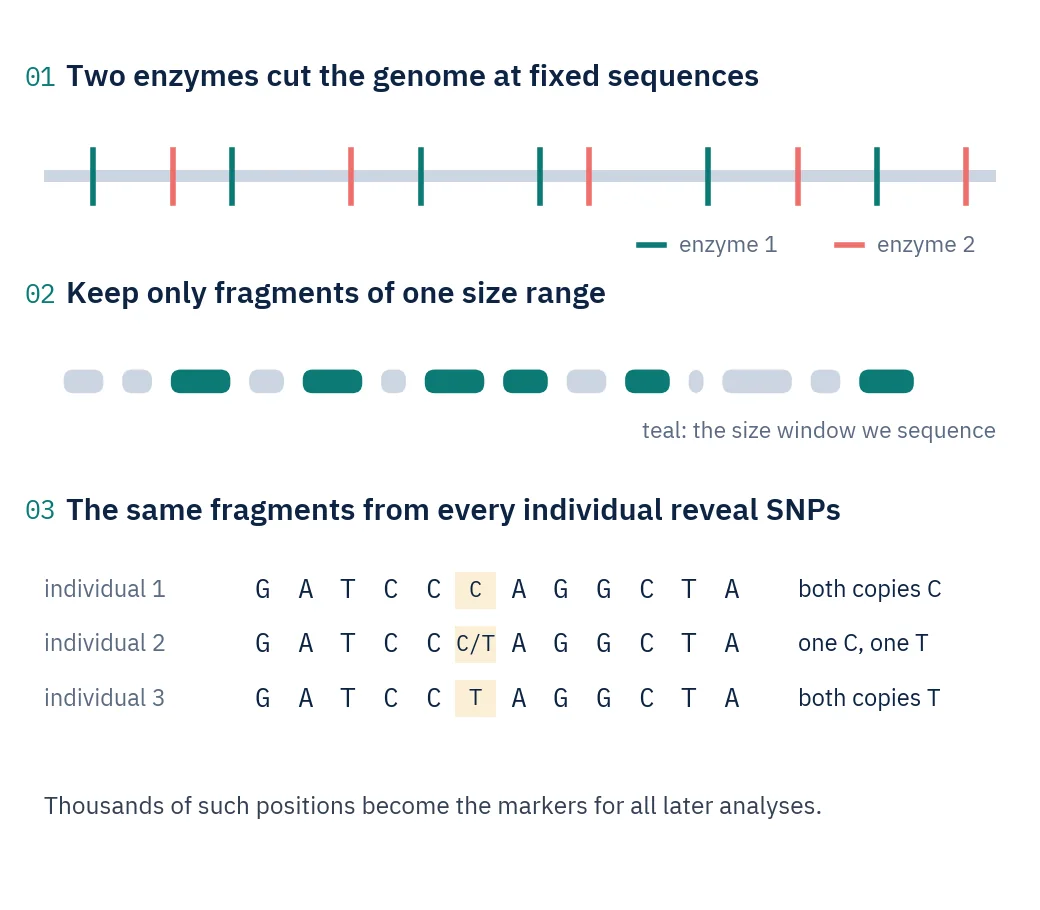
Two restriction enzymes cut the DNA wherever they find their short target sequences. The lab keeps only fragments within a narrow size window. Because the cut sites are the same in every individual, everyone contributes the same set of fragments.
Reads from those fragments are compared across individuals. Positions where individuals carry different letters are SNPs, and each individual’s genotype at thousands of SNPs becomes the data for structure, diversity and relatedness analyses.
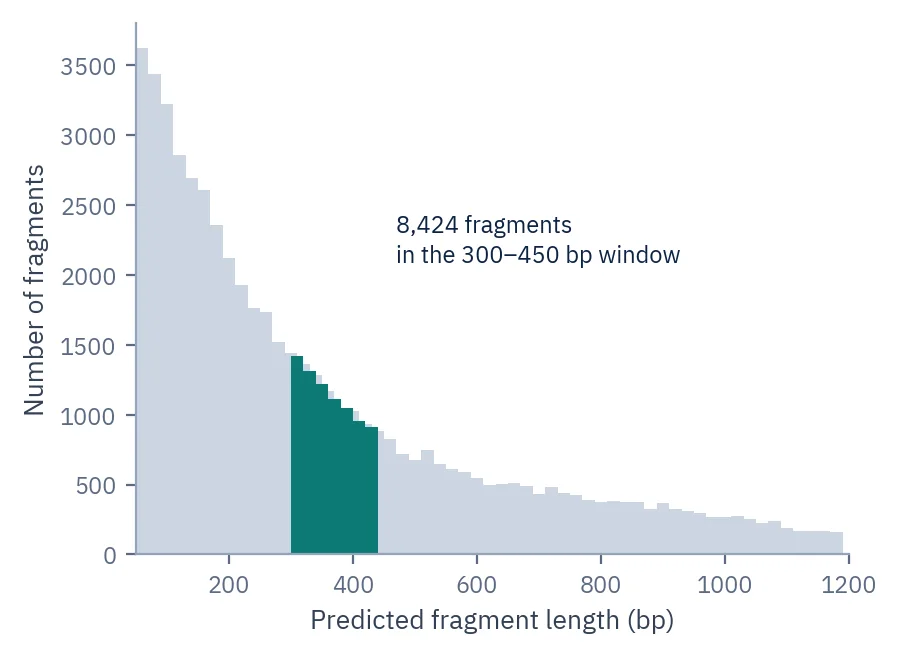
Before any lab work, the enzymes are tested on a computer: we cut the reference genome in silico with candidate enzyme pairs and predict how many fragments fall into the size window.
Key terms
- Restriction enzyme
- A protein that cuts DNA wherever it finds one specific short sequence.
- Size selection
- Keeping only DNA fragments of a chosen length, so every individual contributes the same pieces.
- SNP
- A single DNA letter that differs between individuals, for example A in some and G in others.
- Fst
- A measure from 0 to 1 of how genetically different two populations are. Higher means more different.
- Heterozygosity
- The share of positions where an individual carries two different versions. Low values can signal inbreeding.
- Kinship
- How closely two individuals are related, from duplicates to unrelated.
Bring the question. We design the experiment around it.
- How many genetically distinct populations do I have?
- How different are my sampling sites or breeding lines from each other?
- Is diversity dropping, or is there inbreeding in this population?
- Are some samples duplicates, siblings or close relatives?
Where it is used
- Breeding programmesStructure, diversity and relatedness in broodstock, breeds and breeding lines.
- Population geneticsHow populations are structured and how different they are.
- Conservation geneticsDiversity and inbreeding in small or isolated populations.
- SNP array designTurning discovered markers into a custom genotyping array for routine screening.
- Species without a genomeLoci built directly from the reads when no reference genome exists.
- Enzyme screeningHow many loci candidate enzyme pairs give for your genome, before any lab work.
Four steps from DNA to population answers.
- Step 1
Pick the enzymes
We simulate digests of your reference genome, or a related one, and choose the enzyme pair and size window.
- Step 2
Check the DNA
ddRAD needs intact DNA, so amount and integrity are checked before library preparation.
- Step 3
Build libraries and sequence
Every individual’s DNA is cut, size-selected, barcoded and sequenced.
- Step 4
Call SNPs and analyse
SNPs are called with three independent methods, every individual is genotyped at every site, and the markers go into the population analyses.
What the analysis shows you.
Choosing enzymes before sequencing
A simulated digest of the reference genome. The teal window marks the fragments that would be sequenced, and the label gives how many there are.
How different are the populations?
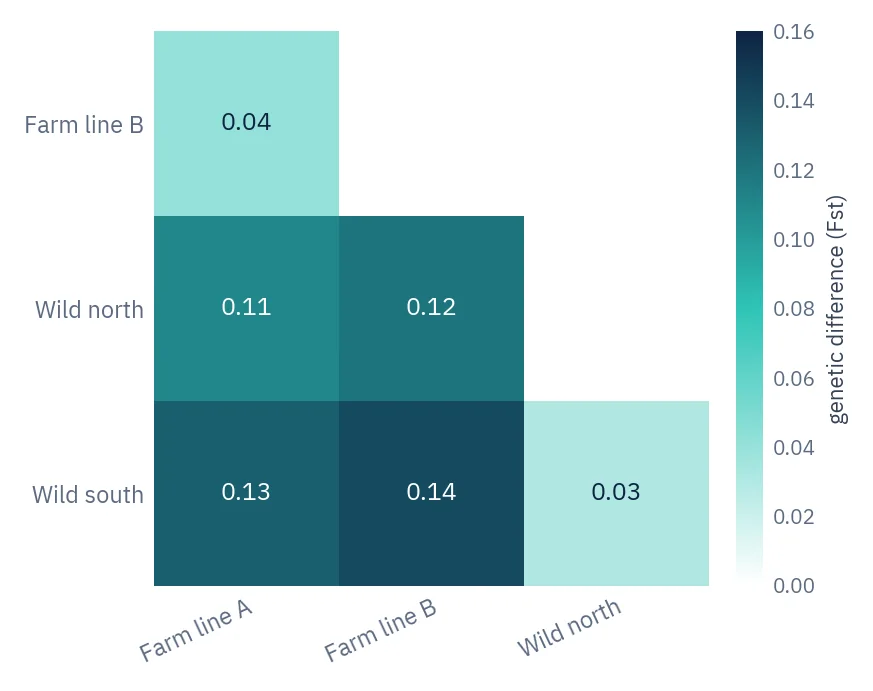
Pairwise Fst between four populations. Darker cells mean stronger genetic differences; here the farmed lines differ clearly from the wild ones.
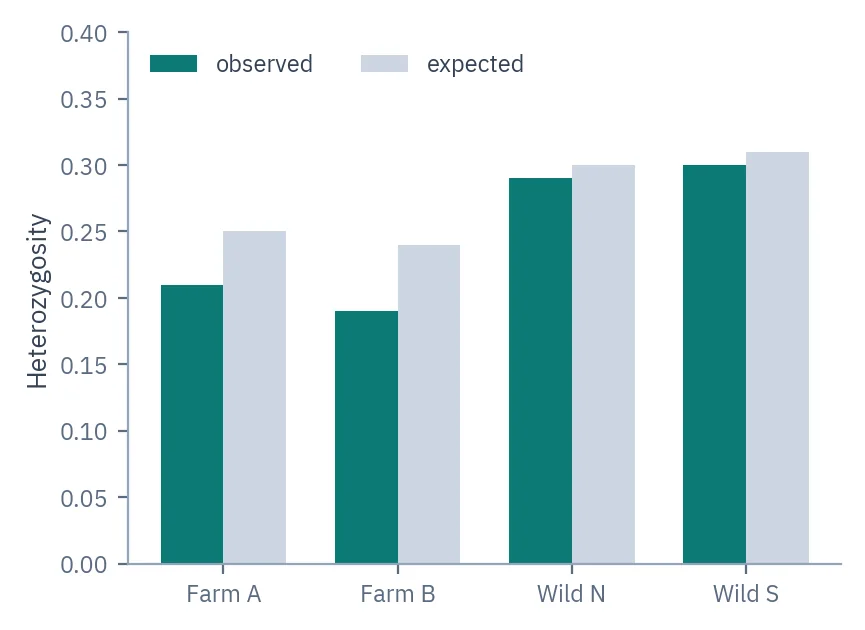
Genetic diversity per population
Observed against expected heterozygosity. Where observed diversity falls below expected, as in the farmed lines, inbreeding is likely.
Included as standard every project
- Read quality control and alignmentReads are trimmed and placed on the reference genome.
- Consensus SNP callingSNPs called with three independent callers and kept where they agree.
- Cohort genotypingEvery individual genotyped at every agreed site, so allele frequencies stay unbiased.
- Marker filteringUnreliable SNPs removed, and linked markers thinned before structure analyses.
- Population analysesPCA, ancestry proportions, Fst, heterozygosity and a genetic tree.
Added for your question custom
- KinshipPairwise relatedness to find duplicates, siblings and parent–offspring pairs.
- SNP array designArray-ready marker sequences, one SNP per locus, with nearby interfering SNPs flagged.
- Enzyme screening for new genomesDigest simulations on any reference genome before the lab work starts.
- Analysis without a referenceLoci assembled directly from the reads when no genome is available.
What goes in, and how we run it.
- Method
- ddRAD with an enzyme pair chosen for your genome
- Before sequencing
- In-silico digest predicts how many loci each enzyme pair gives
- Sequencing
- Illumina NovaSeq X Plus or NextSeq 2000
- Samples
- Tissue, blood, shrimp, insects and plants
- Markers
- Tens of thousands to hundreds of thousands of SNPs, depending on genome and enzymes
- Main tools
- Stacks, bwa-mem2, nf-core/sarek, ADMIXTURE, plink2
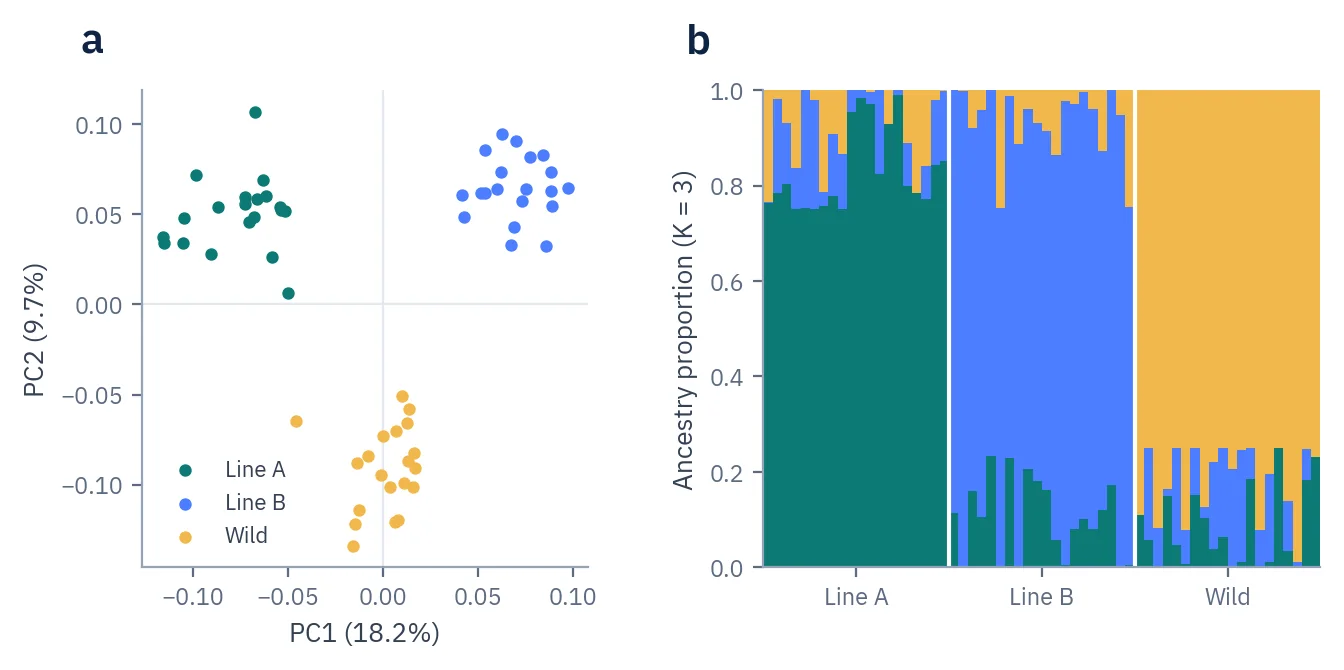
Figures, interpretation and Methods, ready for the manuscript.
- ReportInterpretation written against your hypothesis
- FiguresPublication-ready figures for the manuscript
- MethodsMaterials & Methods text for the paper
- Tables and dataAll results as tables, plus the processed data files
ddRAD or whole-genome resequencing?
Send us the question and we recommend one, including when the cheaper option is enough.
| Aspect | ddRAD | Whole-genome resequencing |
|---|---|---|
| Markers | Tens of thousands to hundreds of thousands of SNPs | Millions of variants across the genome |
| Cost per individual | Low, so large cohorts fit | Higher per individual |
| Reference genome | Not required | Required |
| Best when | Population structure, diversity, relatedness and array design | Every variant matters, including rare ones |
Before you send samples
Related services
How is ddRAD different from whole-genome resequencing?
ddRAD reads the same small part of the genome in every individual, so many more individuals fit the budget. Whole-genome resequencing finds far more variants per individual and costs more per sample.
How do you choose the enzymes?
We simulate digests of your genome, or a related one, with candidate enzyme pairs and size windows, and pick the combination that gives enough loci without wasting sequencing. The number of SNPs then depends on how diverse your population is.
Do I need a reference genome?
No. Loci can be built directly from the reads. A reference from the same species places the markers on chromosomes and makes SNP calling more reliable.
How many reads per individual?
It scales with the number of loci: 10,000 loci read 20 times each need about 200,000 reads per individual. The enzyme screen sets the target before sequencing.
Why use three variant callers?
SNPs that independent callers agree on are more reliable. Every individual is then genotyped at all agreed sites, which keeps allele frequencies across the cohort unbiased.
Can you design a SNP array from the results?
Yes. We select array-ready marker sequences, one SNP per locus, separate markers inside genes from those outside, and flag neighbouring SNPs that would interfere with the probes.
Can you analyse ddRAD data I already have?
Yes. Send the FASTQ files, split per individual, with the reference genome if one exists.
If something goes wrong on this project, you pay €0 to fix it.
- Sample problems €0
- Library prep redo €0
- Resequencing €0
- Reviewer re-analysis €0