
Already have sequencing data? We turn it into answers.
Custom analysis, figures and a Methods section for sequencing data from any provider, core facility or public archive.
From raw files to a checked report.
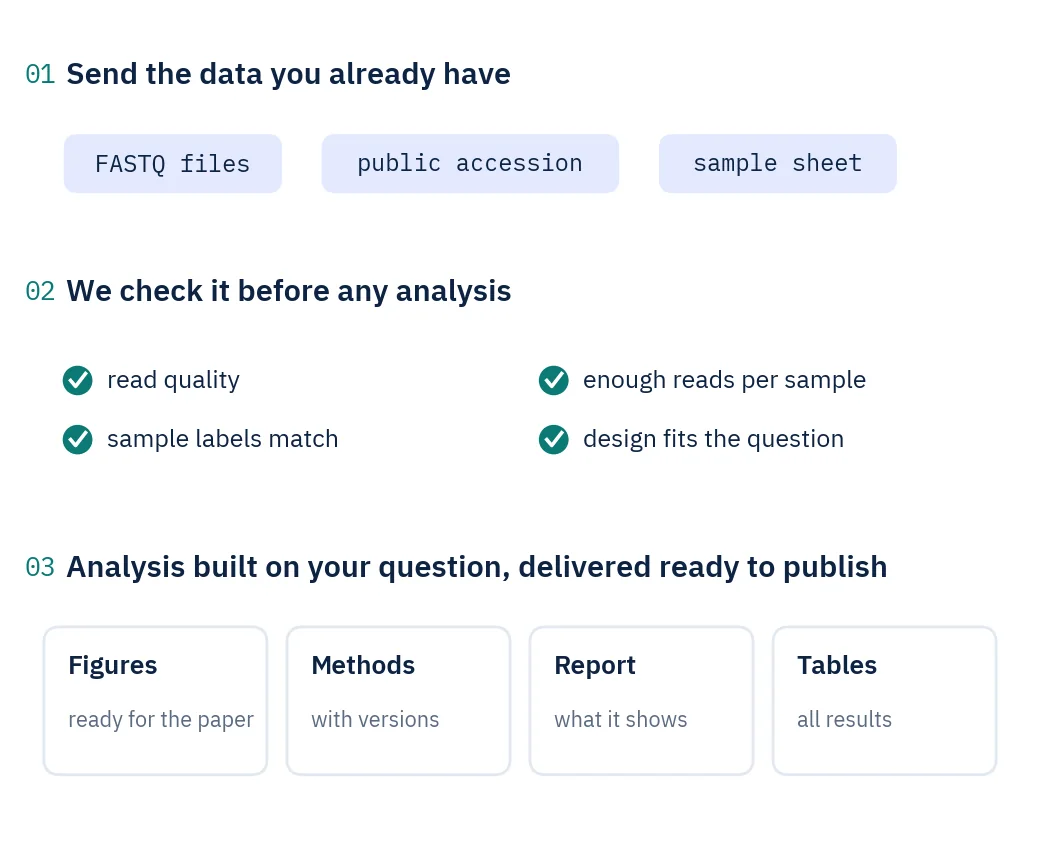
A sequencer delivers FASTQ files: millions of short reads, each with a quality score for every letter. Between those files and a figure in a paper lie many steps, and each assay needs its own. RNA-seq, microbiome, methylation and genome data are all analysed differently.
We start by checking the data: read quality, reads per sample, whether the sample labels match the files, and whether the design supports the comparisons you want. The analysis is then planned around your groups, replicates and question.
Analyses run in versioned community pipelines, and the software versions go into the Methods section. Every number in the report comes from one results table, and automated checks compare the text, tables and figures before anything is delivered.
Key terms
- FASTQ
- The standard file of sequencing reads, with a quality score for every letter.
- Quality control
- Checking that reads are usable, and removing adapter sequence and poor-quality bases.
- Reference genome
- The assembled genome of your organism, which reads are compared against.
- Normalisation
- Adjusting counts so that samples sequenced to different depths can be compared fairly.
- False discovery rate
- The expected share of false positives among results called significant.
- Pipeline
- A scripted, versioned chain of analysis steps that runs the same way every time.
Sound familiar? This is the part we take over.
- Has your data been sitting on a drive for months?
- Did your provider send raw files and no interpretation?
- Has a reviewer asked for an analysis you cannot run yourself?
- Do you need figures and a Methods section for the paper?
Where it is used
- Microbiome data16S, ITS, 18S and COI amplicons and shotgun metagenomes.
- RNA-seqDifferential expression and pathway analysis from bulk RNA data.
- DNA methylationWGBS and RRBS data compared between groups.
- Genomes and exomesGermline variant calling and classification, and genome assembly from long reads.
- Population genomicsddRAD data analysed for structure, diversity and relatedness.
- Immune repertoiresT-cell receptor sequencing: clonotypes, diversity and gene usage.
Four steps from your files to results.
- Step 1
Tell us about the data
A short email with the assay, the organism, the groups and the question. We check that the plan fits the data.
- Step 2
Send the files
Raw FASTQ files through an upload link, or the accession number of a public dataset, plus a sample sheet.
- Step 3
Check the data
Read quality, reads per sample and sample labels are checked before the analysis starts.
- Step 4
Analyse and report
Analysis matched to your design, delivered with figures, tables, a report and a Methods section.
What the analysis shows you.
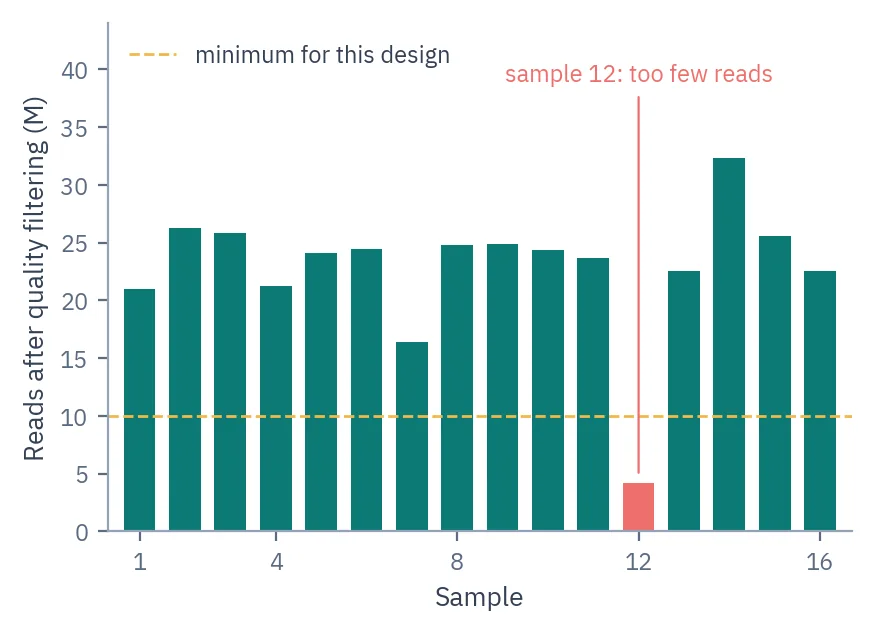
Enough reads in every sample?
Reads left after quality filtering, per sample. One sample falls below what the design needs and is flagged before the analysis starts.
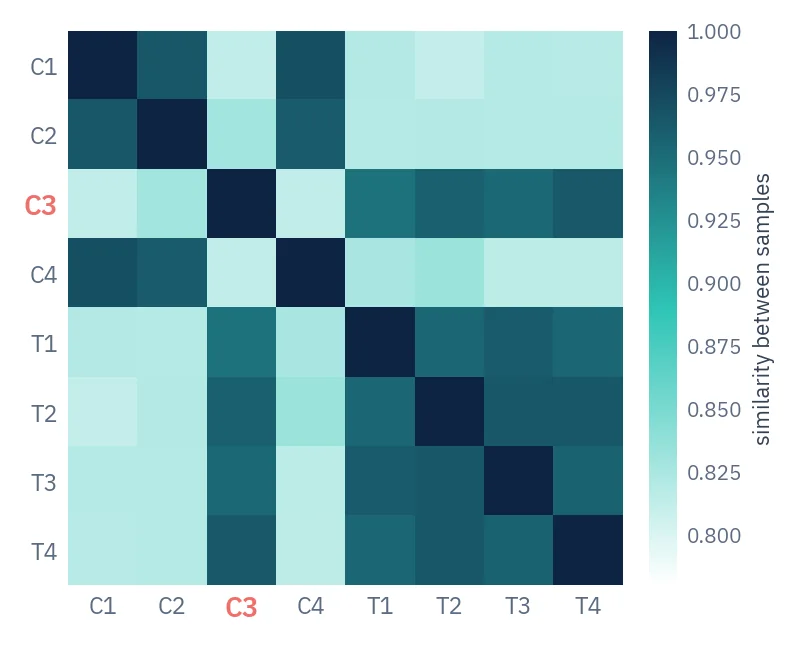
Do the labels match?
How similar the samples are to each other. Sample C3 resembles the treated group, a typical sign of a swapped label that is worth checking before any statistics.
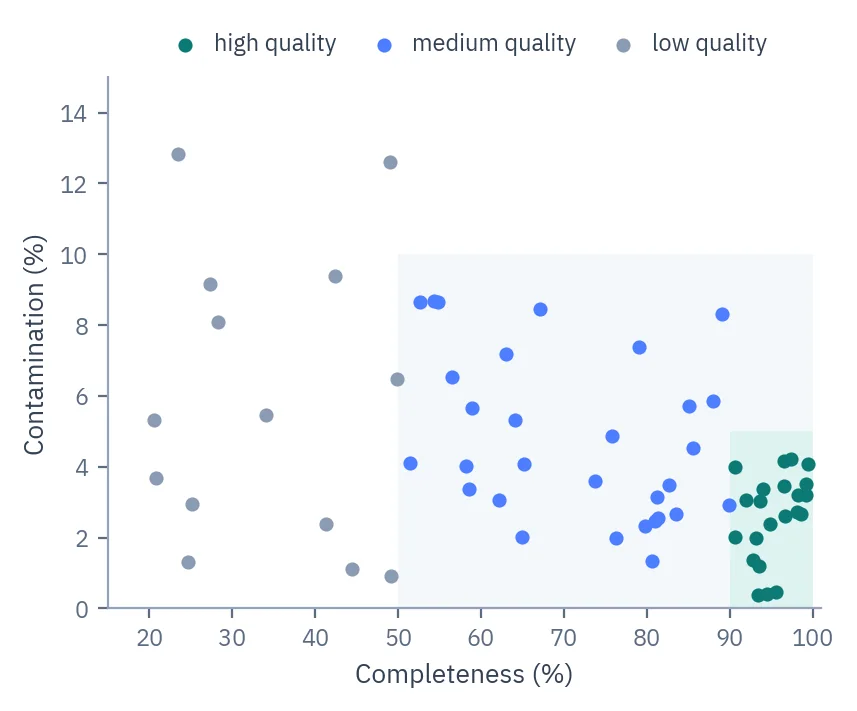
Genomes from a metagenome
Each dot is a draft genome rebuilt from shotgun data. Those in the teal corner meet the high-quality standard for publication.
Included as standard every project
- Data checkRead quality, adapter trimming and reads per sample, summarised for every sample.
- Analysis matched to the assayThe workflow for your data type: microbiome, RNA-seq, methylation, variants, assembly or population genomics.
- Statistics that fit the designGroup comparisons, replicates and multiple-testing correction set up for your study.
- Figures and tablesPublication-ready figures and all results as tables.
- Methods sectionMaterials & Methods text with the software versions used.
Added for your question custom
- Public datasetsRe-analysis of published data by accession number.
- Answers to reviewer commentsAdditional analyses when reviewers ask for them.
- Non-model organismsReference genome and annotation set up for species beyond the usual model organisms.
- Long-read dataOxford Nanopore and PacBio data as well as Illumina.
What goes in, and how we run it.
- Data we take
- Raw FASTQ files · public datasets by accession number
- Assays
- Amplicon, shotgun, RNA-seq, methylation, genomes and exomes, long-read assembly, ddRAD, T-cell receptor repertoires
- Platforms
- Illumina, Oxford Nanopore and PacBio data
- What we need
- Sample sheet with groups, organism and reference genome, library kit
- Delivered
- Report, figures, tables and Materials & Methods text
- Pipelines
- nf-core pipelines with fixed versions
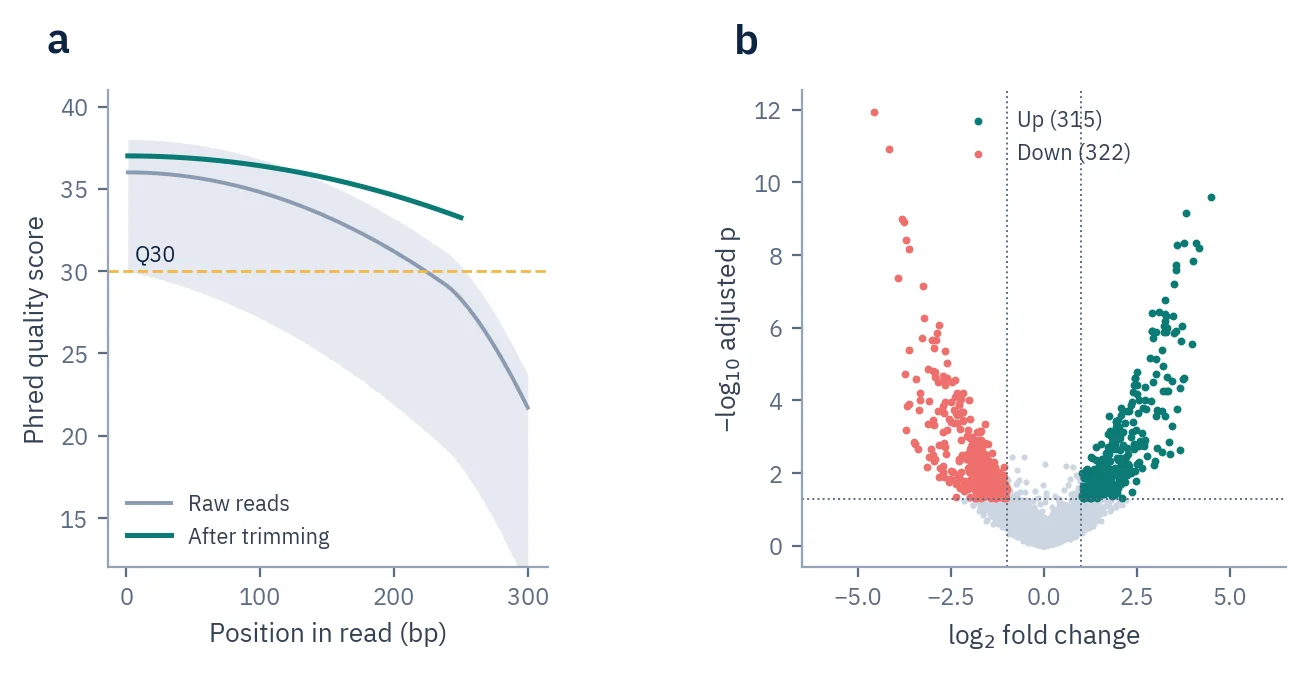
Figures, interpretation and Methods, ready for the manuscript.
- ReportInterpretation written against your hypothesis
- FiguresPublication-ready figures for the manuscript
- MethodsMaterials & Methods text for the paper
- Tables and dataAll results as tables, plus the processed data files
Analysis only or a full project?
Send us the question and we recommend one, including when the cheaper option is enough.
| Aspect | Bioinformatics only | Full project |
|---|---|---|
| You send | Existing data files | Samples |
| We deliver | Analysis, figures, tables and Methods | Everything from sample check and sequencing to figures |
| Guarantee | Covers the analysis and re-analysis | Covers the whole project |
| Best when | The data exists but the answers do not | You are starting a new study |
Before you send data
Related services
What data can I send?
Raw FASTQ files from Illumina, Oxford Nanopore or PacBio, or the accession number of a public dataset, with a sample sheet that lists the groups.
Which experiments can you analyse?
Amplicon and shotgun microbiome data, bulk RNA-seq, DNA methylation, germline exomes and genomes, long-read genome assembly, ddRAD and T-cell receptor repertoires.
My data came from another company. Is that a problem?
No. Many of our projects are analysis-only on data sequenced elsewhere. We check its quality first.
What do you need besides the files?
The organism and reference genome, the library kit or assay, a sample sheet with groups, and the comparisons you care about.
Can you re-analyse a published dataset?
Yes. Send the accession number and tell us what you want to compare.
Will I get a Methods section?
Yes. A Materials & Methods text with the software and versions used, ready to adapt for your manuscript.
How do you make sure the numbers in the report are right?
Every number in the report comes from one results table. Automated checks compare the text, tables and figures, and the figures are reviewed independently before delivery.
What if a reviewer asks for a different analysis?
We run it without a new invoice.
If something goes wrong on this project, you pay €0 to fix it.
- Sample problems €0
- Library prep redo €0
- Resequencing €0
- Reviewer re-analysis €0